
In college, I met with the pre-med Dean we were recommended to meet before applying to medical school. In our first meeting he asked me a very reasonable question, one that I should have been able to answer and that certainly medical school admission committees would expect me to answer. “Why do you want to be a doctor?” This was a more complicated question for me than it should have been because I had only recently decided to apply to medical school after a chance encounter at Yale had persuaded me not to become a straight arrow biology researcher (a story for another time) and I was increasingly drawn to my computer science classes. But I did have an overall motivation so I answered “I want to save lives!” Seemed right to me. The Dean then asked “Well why not become a fireman?”
I stuttered as I swayed between wondering how he had come to that question and trying to come up with a coherent answer. I tried the direct approach and explained that although being a fireman was an honorable profession and did save lives, it was not what I wanted to do. I didn’t think I had the build to be an effective fireman (true but possibly remediable) and I also wanted to do medical research. After some follow-up questions, I don’t think I convinced the Dean, but that was where my pitch landed.
That conversation has stayed with me for decades. I loved my medical training and despite some anticipatory anxiety, my residency training was among the happiest times in my life. It was great to take care of patients and to be part of a clinical team. But I kept asking myself “Was I saving lives?” Were there patients who could, in theory, point to me and assuredly declaim that I had added years to their life? I had to first unburden myself from a higher standard, one exemplified by my late mother who, while being effectively treated for multiple myeloma at the Dana Farber Cancer Institute, explained to me that while she appreciated her oncologist, the lion’s share of her gratitude was reserved for Professor Kaelin, who had made the discovery that led to the availability of the treatment that was so helpful to her. That is, in a Talmudic hierarchy of contributions to human welfare, she prized those who had unique, unsubstitutable contributions. An interesting and defensible standard, but not one which I’ll explore here.
So how many lives are saved by doctors? I was worried about the answer because I was well aware of the historical change in longevity and the very clear relationship to sanitation and nutrition. Against that background even major wins like antibiotics and vaccines were only a small blip. But then I recalled the babies I had resuscitated in the newborn intensive care unit (NICU). If I had not been successful, they would be dead. And in the utilitarian framework I had not only saved their life but, because they might go on to live a full life span, I had saved a lot of life. That is, on average I had saved 79 (the average lifespan of an American) life-years. I’ve made several simplifications to get us briskly through the back-of-the-envelope (BOTE) estimate (e.g. discounting future life-years, sharing credit for the life-years with the senior doctors backing up the residents, discounting quality of life after complications of their NICU stay etc.).
Resuscitations were no longer something I did when I was a pediatric endocrine fellow. Perhaps I could share credit for saving the life of a 3 year old with diabetic ketoacidosis (BOTE, I saved 79 – 3 years = 76. Let’s give the rest of the care team 80% credit, so I saved 76 years and get 20% credit ~15 life-years). Similarly for the cases of first presentations of Addison’s Disease, Diabetes Insipidus and a handful of other conditions. But what about the bread and butter of pediatric endocrine practice? How much was I adding to the life span of a patient with type I diabetes mellitus? Perhaps I was helpful in improving glycemic control by providing lifestyle advice and adjustment of insulin dose? Might that account for another 5-10 years of life? Yet I was one of a large cast of characters contributing to that effort, not least of which was the patient. Would a 5% share in 5 years (3 months) be a fair apportionment? Across 100 such patients it might still add up to 3 * 100 / 12 = 25 life-years. Not bad. But how about the patients who presented with evaluation of short stature? Let’s take a specific case of a boy who stopped growing and I diagnosed him with primary hypothyroidism and after thyroid supplementation he started growing again. It is unlikely he would go through life undiagnosed for that common disease. Perhaps my clinical acumen allowed me to diagnose him a couple of years earlier than another doctor. So let’s give me two years of improved quality of life (less constipation, better class performance, generally less fatigued and improved height). Let’s just arbitrarily stipulate that his quality of life went from 80% to 100% of what it would otherwise have been. So 20% of 2 years is 4.8 months. One hundred patients would be 4.8 * 100 / 12 = 40 life-years. However, I am not going to attempt to make a total estimate for life-years saved as much of my professional time has been devoted to research and I would therefore serve as a poor exemplar of the lives saved by pediatric endocrinologists.
Instead, let’s come up with some estimates for different medical specialties. By necessity these will be inaccurate BOTE calculations, but I am looking for order of magnitude estimates. I will try to be overly generous without being unrealistic. The details and assumptions for these ultrasimple models are shared below.
I just picked a few medical professions. For each one, in generating the BOTE life-years, I have not estimated career-long achievements. Instead all figures are per-worker (doctor) per year, 3% discount, with explicit attribution haircuts of the sort illustrated above. Note that I first estimate for the US and then divide by the number of workers/doctors in that profession to make the estimate. To allow you to correct or counter any mistaken assumptions or missing data, I have linked to the spreadsheets (which also document some of the data sources) from which the summaries below were generated. Further down, I compress the results into two pictures — one showing a curious inversion between per-worker impact and national footprint, and, purely as a sideshow, one asking what each profession’s paycheck implies in dollars per life-year.
As I said at the beginning of this essay, this exploration down a rabbit hole was triggered by a conversation I had 46 years ago. It’s not meant to weigh the human value of any profession.
All the models below use a 3% discount factor per year. That is, people, individually and collectively, generally prefer good health now over the identical good health later. If you do not like that assumption, you can tweak it in the spreadsheet.
General surgeon in an urban hospital practice
A bottom-up model of QALYs saved by a typical urban general surgeon across seven life-threatening emergency operations. Value comes from a few high-counterfactual acute rescues; headline ~15 QALYs/surgeon/year after attributing 60% of the credit to the surgeon — i.e., the surgeon keeps 60% and the remaining 40% is shared with the anesthesia, OR, and ICU team.
| Category | Net lives/yr (US) | National QALYs/yr |
|---|---|---|
| Strangulated bowel obstruction | ~36,000 | ~342,000 |
| Trauma laparotomy | ~12,800 | ~256,000 |
| Complicated cholecystitis | ~9,000 | ~105,000 |
| Perforated peptic ulcer | ~10,000 | ~95,000 |
| Necrotizing soft-tissue infection | ~3,750 | ~46,000 |
| Appendectomy | ~2,000 | ~28,000 |
| Mesenteric ischemia | ~4,500 | ~25,000 |
| Per surgeon (attributed) | ~15 QALYs/yr |
Urban primary care doctor
A bottom-up “panel of 2,000” model plus a top-down mortality anchor (from Basu et al.) for an urban adult PCP. Value is dominated by prevention and quality-of-life, not acute rescue; headline ~27 QALYs/PCP/year.
| Pathway group | Examples | Note |
|---|---|---|
| Prevention + mortality | Hypertension, diabetes, lipids, screening, vaccines | Largest cluster |
| Morbidity / QoL | Depression, chronic symptom control | Bigger than any single mortality lever |
| Per PCP (attributed ~37%) | ~27 QALYs/yr (could easily range from 15–30) |
Neonatologist
A stratified-by-gestational-age model of QALYs saved in the NICU, with disability-weighted survival. Highest per-worker of any profession (~96 QALYs/neonatologist/year) because saved lives are newborns; extremely sensitive to the discount rate.
| Gestational-age band | Net lives/yr | National QALYs/yr |
|---|---|---|
| Extremely preterm (<28 wk) | ~13,600 | ~300,000 |
| Very preterm (28–31 wk) | ~18,000 | ~441,000 |
| Moderate preterm (32–33 wk) | ~7,560 | ~204,000 |
| Late preterm (34–36 wk) | ~3,500 | ~98,000 |
| Term critically ill | ~9,000 | ~229,000 |
| Per neonatologist (attributed 40%) | ~96 QALYs/yr (0% discount ~230; 5% ~60) |
Firefighter
A multi-pathway model for an urban career firefighter; EMS first response (cardiac arrest, overdose) dominates, not fire suppression. Large aggregate impact but very low per-worker (~0.56 QALYs/year) because ~370,000 firefighters share a diffuse chain-of-survival.
| Pathway | System net lives/yr | Attributed QALYs/yr |
|---|---|---|
| Cardiac arrest (CPR/AED) | ~36,750 | ~99,000 |
| Opioid overdose (naloxone) | ~30,000 | ~80,000 |
| Fire suppression & rescue | ~2,500 | ~12,000 |
| Vehicle extrication | ~1,500 | ~9,000 |
| Fire prevention | ~1,000 | ~5,000 |
| Per firefighter (attributed 30%) | ~0.56 QALYs/yr |
Summary I
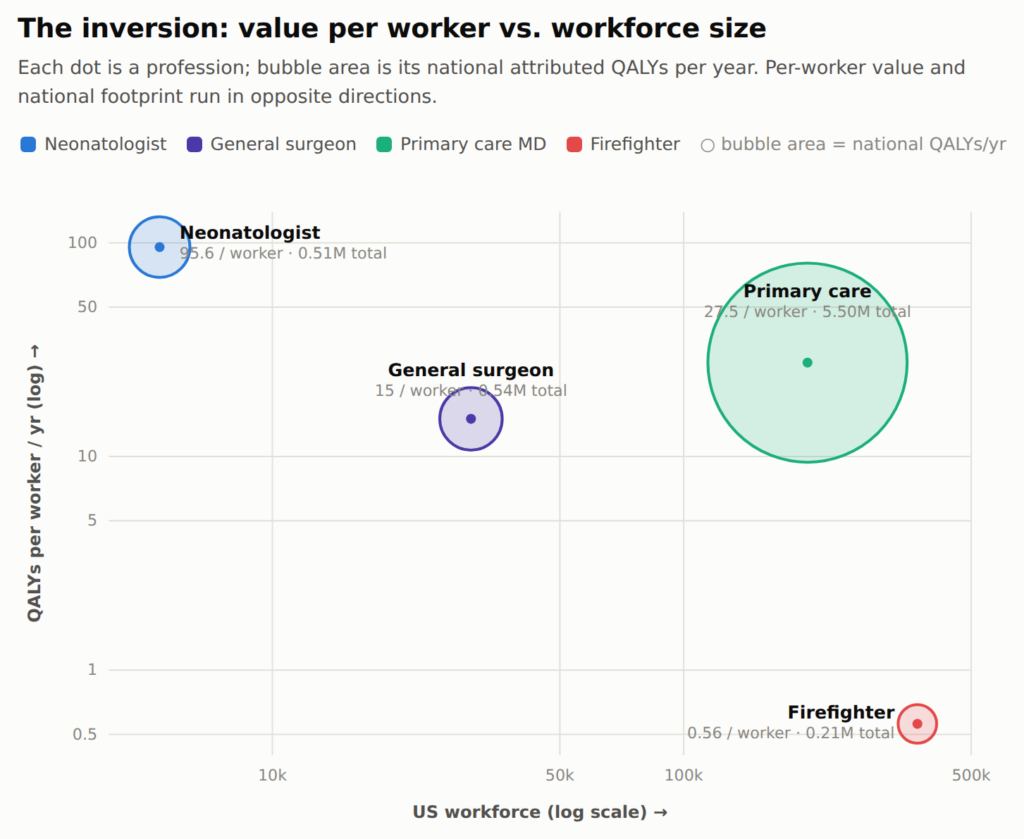
The table below summarizes the four models above. Firefighters are the same order of magnitude as general surgeons in aggregate. But because there are so many more firefighters than general surgeons, the per-person QALYs saved is larger for the surgeons. Primary care however wins on aggregate precisely because it’s diffuse. And there’s the rub, we have not succeeded in training or recruiting primary care doctors for decades. The growing gap between supply and demand in primary care is exactly what drove me to write the “Compared with What? Measuring AI against the Health Care We Have” perspective:
| Profession | QALYs/worker/yr | Attribution | National attributed QALYs/yr |
|---|---|---|---|
| Neonatologist | ~96 | 40% | ~510,000 |
| Primary care MD | ~27 | 37% | ~5,500,000 (approx) |
| General surgeon | ~15 | 60% | ~540,000 |
| Firefighter | ~0.6 | 30% | ~206,000 |
The inversion is easier to see as a picture: per-worker value and national footprint run in opposite directions. A neonatologist accounts for roughly 170 times the annual life-years of a firefighter, but there are about 70 times more firefighters and primary care sits low per doctor while its national bubble dwarfs everything else.
There are implications here for the scale-up of primary-care with AI but that’s for a different blog post.
Summary II — What if mortality, not quality, matters?
How much does the quality of life considerations impact the above life-year estimated? Here are the same four professions re-run under a strict rule. Let’s just say all we care about is saving that person’s life. Not making it better quality. So, for pure life-years (no quality weighting), mortality only, direct personally-performed interventions only. Let’s remove prevention and quality of life credits and what we see is a reordering of the professions and the collapse of primary care.
| Profession | Strict life-years/worker/yr | vs QALY view | Why |
|---|---|---|---|
| Neonatologist | ~116 | ↑ from 96 | Disability weighting removed |
| General surgeon | ~22 | ↑ from 15 | All acute rescue; quality weight removed |
| Primary care MD | ~5 → ~10–13* | ↓ from 27 | *Depends on the definition: ~5 if chronic-disease medication is treated as excluded “prevention”; ~10–13 if the fatal events it prevents (e.g. a stroke averted after years of blood-pressure control) are counted as direct mortality credit. See Version note. |
| Firefighter | ~0.8 | ~flat from 0.6 | Already direct rescue |
Sideshow — what do we pay per life-year?
Having computed QALYs per worker, I gave in to the temptation to make a meaningless comparison: life-year per dollar of salary. Take a rough annual compensation for each profession. That is, approximately $380,000 for a neonatologist, $410,000 for a general surgeon, and $290,000 for a primary care doctor (from recent physician compensation surveys), and the Bureau of Labor Statistics median of $59,530 for a firefighter, and divide by the QALYs per worker per year from Summary I. The result is the wage cost of one quality-adjusted life-year, which can be set against the $50,000–$150,000 per QALY that US health economists conventionally treat as “worth paying” for a medical treatment. By this deliberately narrow (and as we shall see bogus) yardstick, every profession is a bargain: a neonatologist’s salary buys a quality-adjusted life-year for about $4,000, a primary care doctor’s for about $10,500, a general surgeon’s for about $27,000, and a firefighter’s for about $106,000 — the only one that even reaches the range we routinely pay for a single drug.
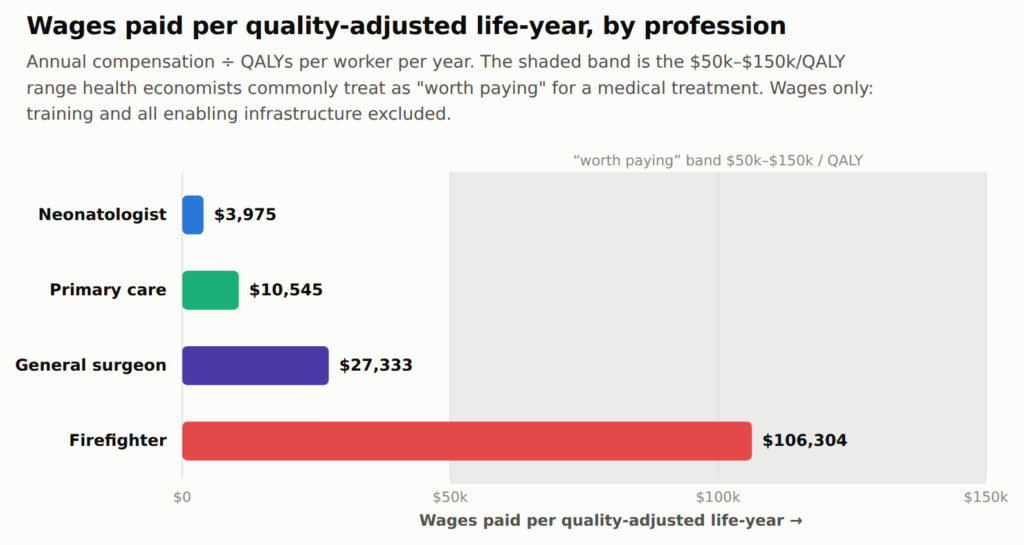
Before anyone quotes these numbers, here is some of what they deliberately ignore and therefore render them bogus:
- Training costs. A general surgeon stands on 13+ years of post-secondary education and training (college, medical school, five or more years of residency), much of it publicly subsidized through graduate medical education; a firefighter’s academy is measured in months. Amortizing training would raise the physician bars considerably while barely moving the firefighter’s.
- Ancillary resources, facilities and supplies. None of the enabling infrastructure is counted: operating rooms, anesthesia and nursing teams, drugs and devices behind each surgeon; NICU beds are among the most expensive real estate in any hospital. Further, behind each neonatologist, dozens of devices each that require expert maintenance and debuggin. Of course there are, engines and protective equipment behind each firefighter. Yet the figures above are wages per QALY, not the more relevant cost per QALY.
- The rest of the team. The QALY numerators were already haircut to one worker’s attributed share, but delivering that share still requires paying everyone else in the chain.
- Average, not marginal. These are average figures; the next worker hired adds less than the average one (Basu’s marginal-PCP estimate shows how large that gap can be), and real purchasing decisions happen at the margin.
- Non-QALY outputs. Firefighters protect property and provide disaster response; physicians teach and generate research. None of that is in the numerator.
Training is the one we can at least sketch. A worker only delivers value after the pipeline is finished, so if we amortize that pipeline over, say, a 15-year working window, the per-year rate becomes the raw rate multiplied by 15/(15 + years of training). This is crude. It ignores discounting, assumes a flat 15-year career, and counts college as “training.” It does however makes the surgeon-versus-firefighter contrast concrete. A decade-plus physician pipeline erases close to half of the annual rate, while a firefighter’s academy erases about a sixteenth. It narrows the gap between the professions without closing it.
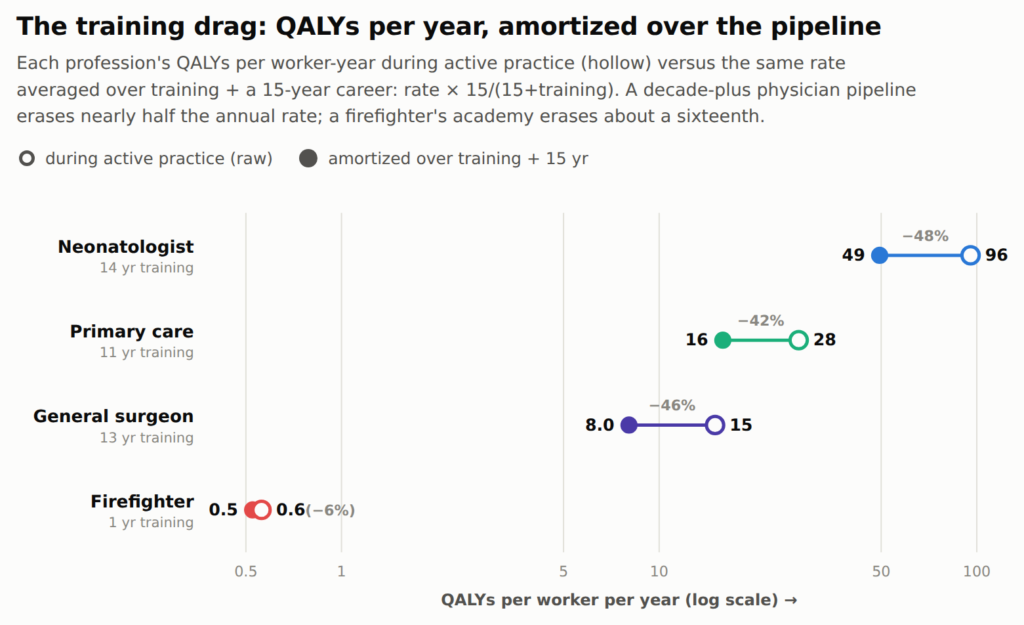
And, as with everything above, the BOTE error bars propagate: the discount-rate and attribution levers move these dollar figures by the same 2–4×.
And here are the links to the spreadsheets used to make the above tables:
Summary Comparison but only mortality, not quality of life
Loud caveat: given that this is Back Of The Envelope (BOTE) methodology, every table should ber at most taken for order-of-magnitude estimates, and two levers (the discount rate and the attribution haircut) move them by 2–4×, so these are best framed as illustrative structure, not a precise leaderboard.
So, maybe, all those years ago, I could have told the pre-med Dean, “I’d prefer to be a doctor and I’ve estimated that individually I am more likely to save more life-years.” I suspect a psych eval would have then followed shortly, as well as a warning to all medical school admissions committees.
I will be returning to it in the near future in discussing the impact of various health interventions, including the use of AI. Credit attribution is going to be interesting.
If you spot any gross errors in the above BOTE calculations, please let me know.
Version note
Updated 16 July 2026, in response to the first comment (thank you, rs).
- Clarified the surgeon attribution wording. The “60%” is the share the surgeon keeps (attributed = gross × 0.60), not the fraction removed; the other 40% is shared with the anesthesia, OR and ICU team.
- Primary care in Summary II was too harsh at ~5. A prevented fatal stroke after years of blood-pressure control is a death averted and belongs on the same footing as a surgeon’s averted death; discounting already handles the delay. Counting those fatal events as direct mortality credit lifts strict primary care to ~10–13 life-years/PCP/year, roughly halving the gap to surgery (~22). The ~5 figure only holds if chronic-disease medication is excluded as “prevention.”
- The firefighter figure is, if anything, generous rather than harsh: its two dominant pathways (cardiac arrest and opioid overdose) are exactly where credit is most diffuse and “a life saved” is least certain, so ~0.6 QALYs/year is closer to a ceiling than a floor.
- EMS and nursing are the natural next professions. Early guess: once each carries a modest explicit attribution, nurse → primary care → surgeon likely cluster within about one order of magnitude, leaving neonatology and firefighting as the two outliers. This is a surprisingly small spread across the acute-care middle.


