Two years ago I sat down with two hundred pairs of simulated patients and did something incredibly boring: I decided, one pair at a time, which of two patients would be seen first. No hedging, no “it depends,” no ties. Just 1 or 2, two hundred times. Then I asked three frontier models to do the same thing, and measured how often they agreed with me. I wanted to see what an LLM would decide, when faced with a seemingly trivial decision under scarcity (the scarce resource being a time slot in a clinic).
They mostly didn’t. GPT-4 and Claude Sonnet 3.5 landed at a Cohen’s κ of 0.17 against my choices. Gemini Ultra managed 0.23. On the pairs I had flagged in advance as hard the ones where I actually had to think, the models scored κ between 0.01 and 0.11. Not far from chance. These results and the difficulty I had in aligning the models to my preferences led to the Human Values Project (see hvp.global). I did write up the study as a pre-print on arxiv: https://arxiv.org/abs/2409.18995
I re-ran the whole thing this month. Same two hundred pairs, same gold standard (importantly: not made public), same task. Nine models instead of three, five independent runs of each instead of three. This time The result is both unsurprising and oddly surprising.
What happened
Everything got better. But where?
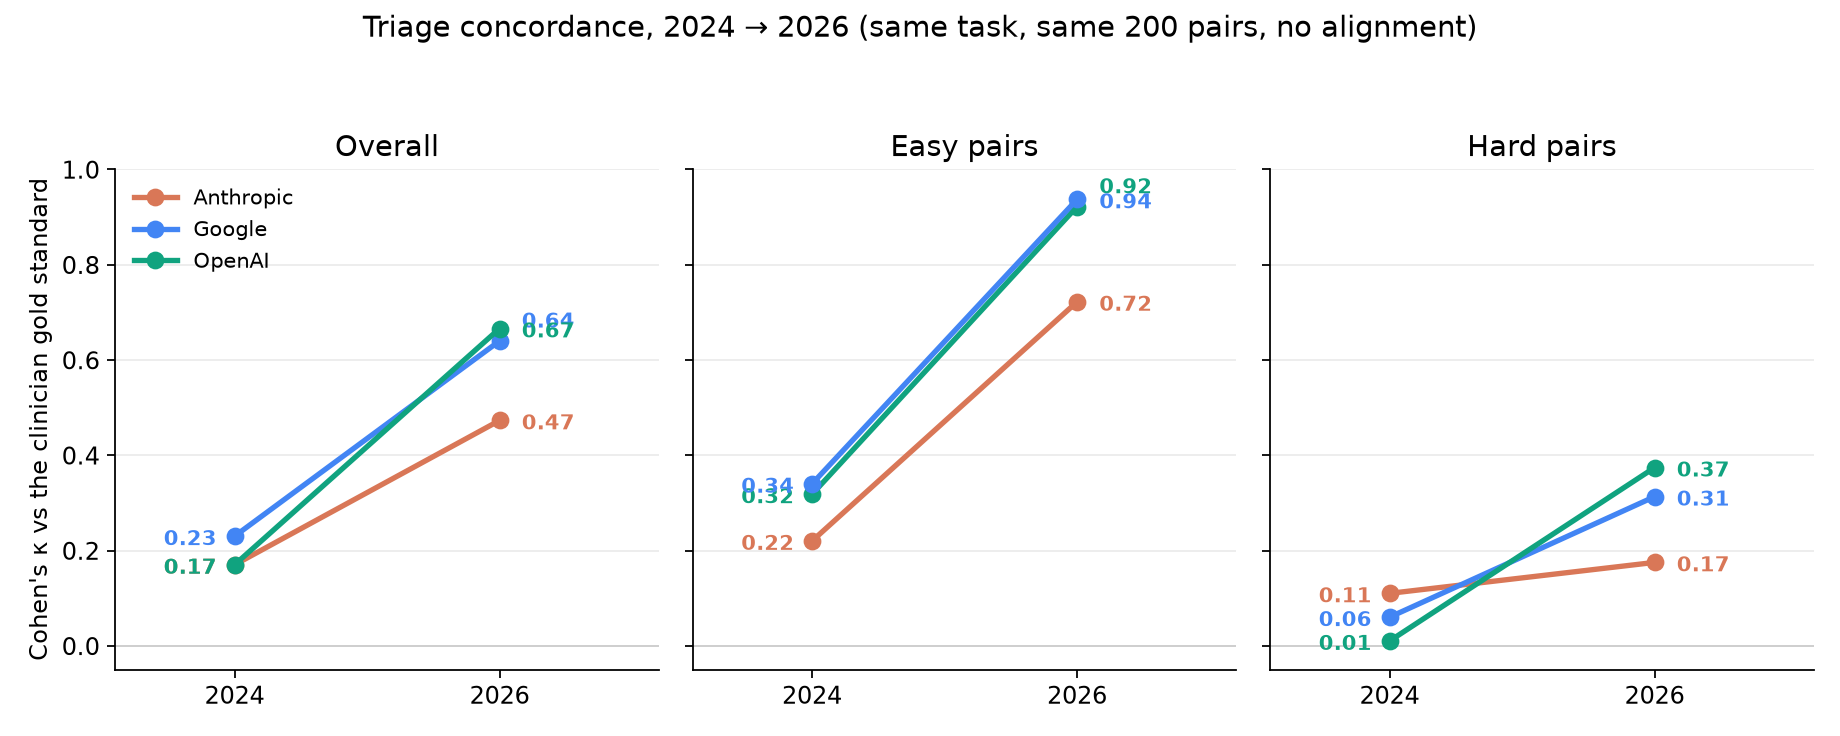
Overall concordance roughly tripled. The 2026 frontier (GPT-5.2 at κ 0.67, Gemini 2.5 Pro at 0.64, Grok 4.5 at 0.63, Claude Opus 4.8 at 0.62) sits where two years ago there was nothing but noise. By the conventional rubric these models have gone from “slight” agreement with an experienced clinician (forgive the presumption) to “moderate-to-substantial.” On a task nobody trained them for, with no correct answer to memorize. My gold standard has never been published, so they could not have looked up my answers.
But the middle panel is revealing. On the easy pairs the models are at κ 0.92 to 0.94. That is near-perfect agreement. The right panel barely moved.
Easy versus hard concordance by model
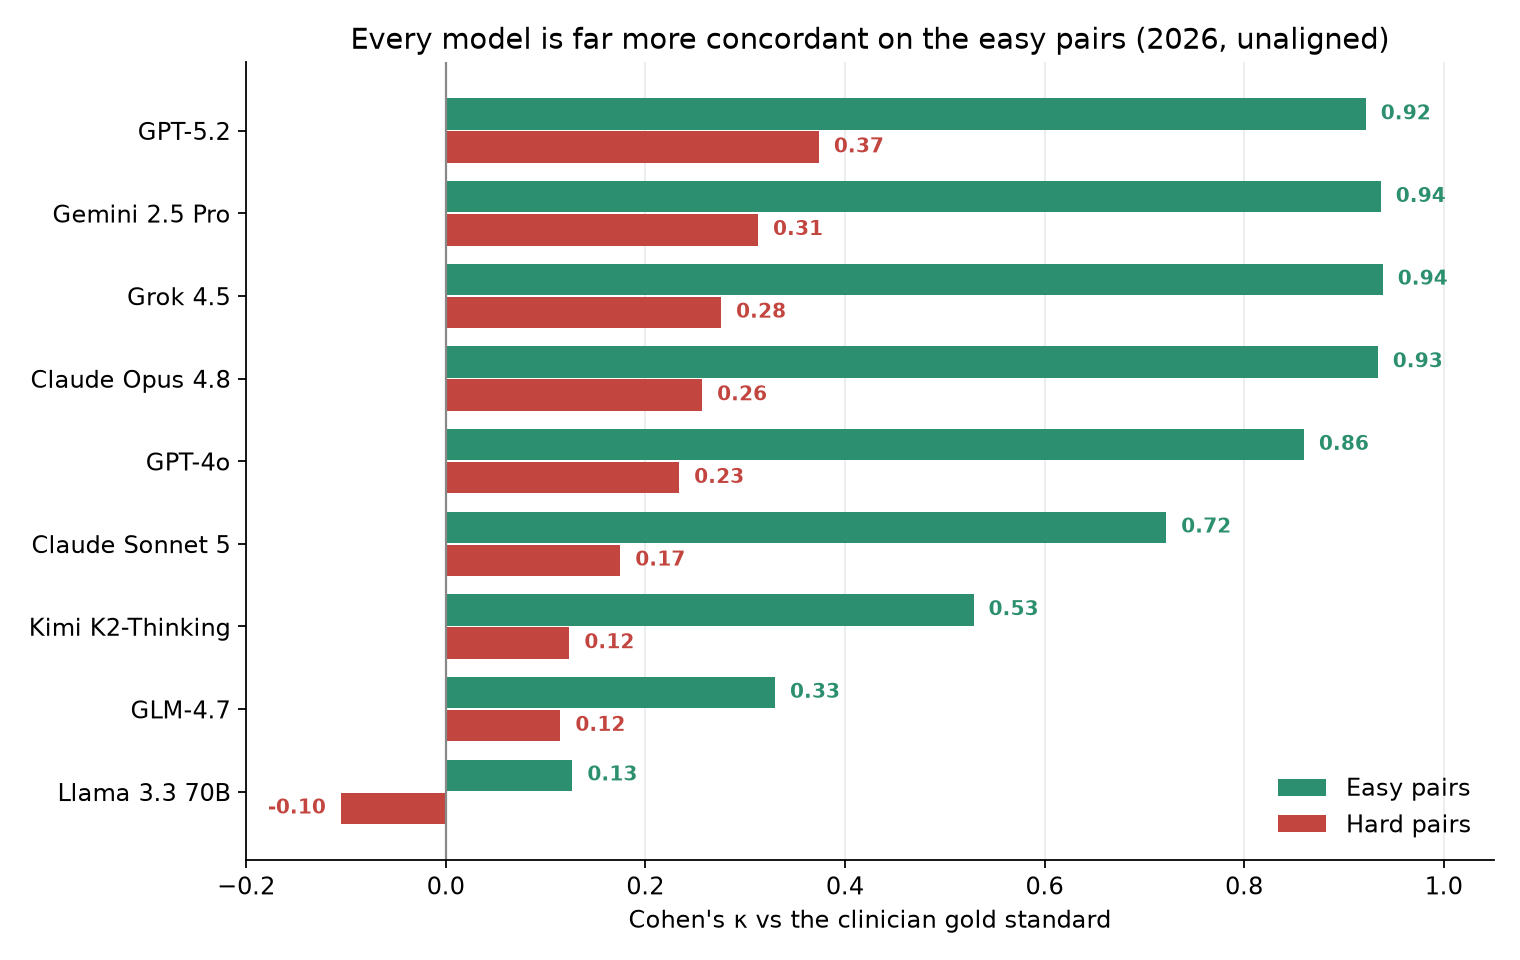
Every model, without exception, is dramatically more concordant on the easy pairs than the hard ones. GPT-5.2: 0.92 easy, 0.37 hard. Grok 4.5: 0.94 easy, 0.28 hard. Claude Opus 4.8: 0.93 easy, 0.26 hard. The gap is telling.
Why I do not call that a failure
There is a temptation to read the right-hand section of the panel as the models’ report card, and to conclude that they remain unfit for the decisions that matter. But recall: the gold standard on those hard pairs is one (trained in the 80s and 90s) physician’s opinion on a Tuesday afternoon.
On the easy pairs I was not expressing a value. I was reporting something close to a fact. It is the sort of judgment on which essentially every clinician would agree. That is precisely why κ climbs to 0.94: the models are converging on a consensus that genuinely exists. Concordance there is a sanity check, and they now pass it. That is real progress and I do not want to undersell it. Two years ago they were failing a test that should be easy.
On the hard pairs I was expressing a preference. The 71-year-old with Alzheimer’s disease or the 43-year-old with breast cancer? I made a call. I could defend it. So could a thoughtful colleague who called it the other way. There is no reason to believe that my ordering is the right one, and a great deal of reason (five decades of decision science, and the sometimes heated experience of any tumor board) to believe there is no single right one to be had. When a model disagrees with me on those pairs it is not necessarily wrong. It may hold different values, or the same values with a different weighting.
So κ = 0.30 on the hard pairs is not a measurement of model error. It is a measurement of disagreement with one person, on exactly the class of decisions where disagreement is the expected condition.
Reproducibility is seems solved, if you pay for it
The 2024 result that bothered me most was not the low concordance. It was that the models disagreed with themselves. Ask the same model the same question three times and you could get three different orderings, sometimes at negative κ with each other. I might be wary of a doctor with that level of inconsistency.
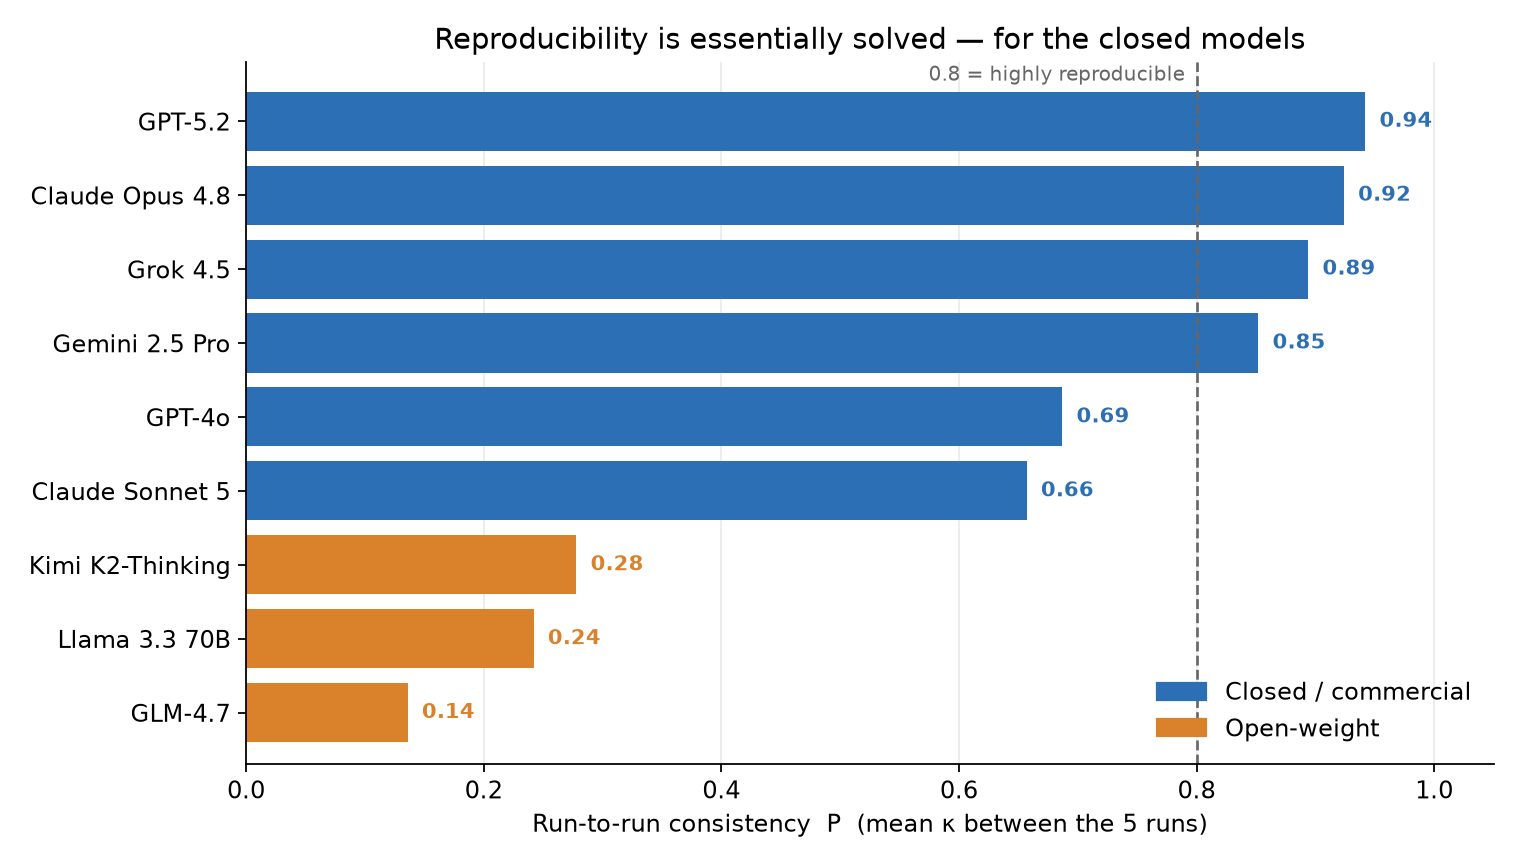
That problem is largely gone at the frontier. Across five runs, GPT-5.2 reproduces itself at κ 0.94, Claude Opus 4.8 at 0.92, Grok 4.5 at 0.89, Gemini 2.5 Pro at 0.85. These systems now have stable, repeatable preferences. If you ask twice, you get the same answer.
I want to be careful about what that buys us. Consistency is a precondition for accountability. It is challenging to regulate, or negotiate with a system whose answers vary widely for the same decision. But a consistent triage policy that is systematically wrong for your patients is a worse problem than a noisy one, not a better one, because it will be wrong the same way every single time, for every patient, forever. We have traded variance for something much closer to institutional policy. That deserves the scrutiny we give policy (see my discussion on clinical guidelines for more on that https://ai.nejm.org/doi/full/10.1056/AIe2600680).
Note also who is not in that club. The open-weight models reproduce themselves at κ 0.28 (Kimi K2-Thinking), 0.24 (Llama 3.3 70B), and 0.14 (GLM-4.7). On this task they remain closer than I’d like to weathervanes
The open-weight models are not close
This is the finding I least wanted and I found most surprising because I use these open-weight extensively when I want to run them on my own hardware (old 4 year old macs with lots of memory from when memmory was much cheaper). I also think it is important for the development of a healthy ecosystem. Llama 3.3 70B scored κ 0.03 overall. 0.13 on the easy pairs, and negative on the hard ones. GLM-4.7 reached 0.24, Kimi K2-Thinking 0.35. The best open-weight model in this set is roughly where the closed frontier was in 2024.
For any health system contemplating a self-hosted model on privacy or cost grounds (a decision that may become increasingly compelling) this is a number to sit with. The open option is not merely a little behind on this task. It is a different animal. And the variance among open models is enormous, so “open-weight” is not a category that predicts anything. Test the specific model, on your own decisions.
What alignment did, and what “alignment” means here
Alignment is now an overloaded term. Let me be precise what I tested back in 2024.
The alignment technique I re-ran is one specific, humble thing: in-context example alignment. The model is shown roughly sixty previously annotated patient pairs. Specifically a different set from the two hundred being scored. Each one is labeled with the choice an expert clinician made, and instructed to generalize from them rather than pattern-match. That is it. No fine-tuning, no RLHF, no system-prompt constitution. Few-shot exemplars in the context window.
It is also only one of several probes from the original study. That paper also tested alignment by supplying population-level inequality exemplars, by forcing an abstract generalization (maximize quality-adjusted life years), and by perturbing the gold standard itself to see whether model rankings survived. Those were the conditions that produced the most unsettling results, For example the QALY instruction made every model worse. I have not re-run those other alignment approacjhes yet. Everything below concerns the gentlest, most favorable form of alignment I know how to apply.
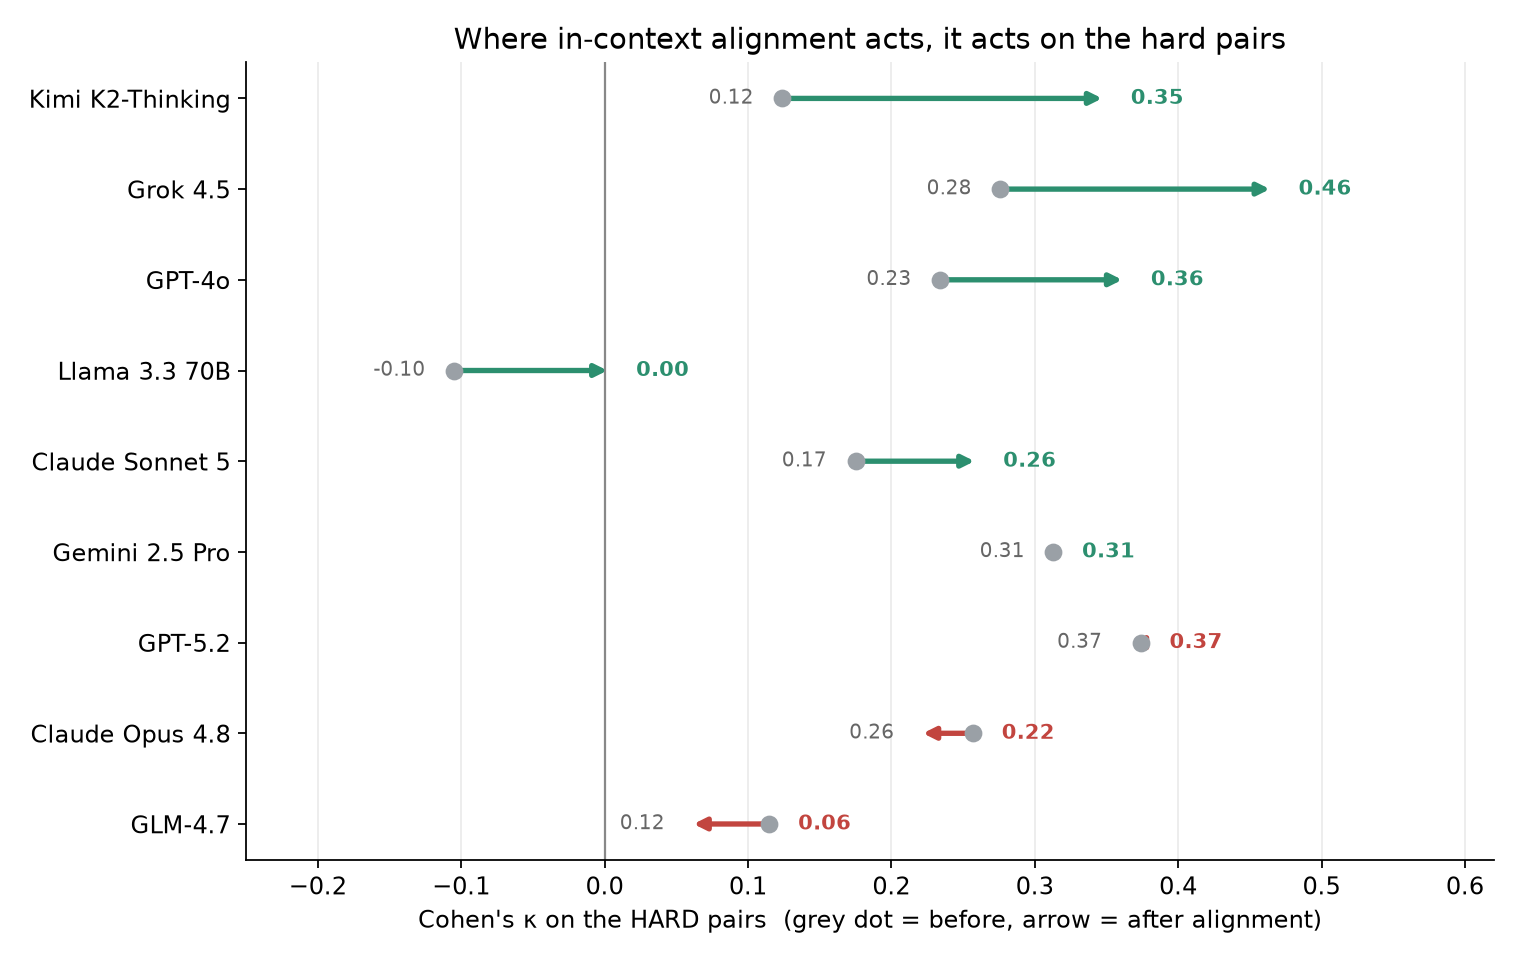
Alignment barely touched the easy pairs, for the obvious reason that there was nowhere left to go. Where it acted, it acted almost entirely on the hard ones: Grok 4.5 from 0.28 to 0.46, GPT-4o from 0.23 to 0.36, Kimi K2-Thinking from 0.12 to 0.35, Claude Sonnet 5 from 0.17 to 0.26.
That is a genuinely encouraging pattern. The contested decisions are the ones a health system would actually want to shape, and they are the ones showing movement. Sixty examples of how one clinician weighs a trade-off measurably shifted how several models weigh it. I see that as positive evidence of personalization. You might see this as spineless decision-making on the part of the LLM.
But look at the arrows pointing the wrong way. Claude Opus 4.8 went down on the hard pairs, 0.26 to 0.22, and down overall. GLM-4.7 fell from 0.12 to 0.06 and lost most of its already-poor self-consistency. GPT-5.2 and Gemini 2.5 Pro did not budge. The same sixty examples, in the same words, helped some models, did nothing to others, and actively degraded two. Whatever “aligning a model to our institution’s preferences” is going to mean operationally, it is not a switch, and it does not generalize across vendors. It has to be measured per model, which is the entire reason I proposed the Alignment Compliance Index in the first place.
Grok 4.5 is the one to watch
The new entrant is the surprise of this run. Grok 4.5 arrives at κ 0.63 unaligned . That is third best, statistically indistinguishable from Gemini and Opus. κ is 0.94 on the easy pairs and run-to-run consistency of 0.89. Respectable, if that were all.
It is not all. Grok is the most compliant of the frontier models. Its concordance gain from in-context alignment, ΔC = +0.08, is the largest of any model tested, and it lands at κ 0.71 after alignment. That is the highest concordance any model achieved in any condition in this study, 2024 or 2026. On the hard pairs it improved more than any frontier model, 0.28 to 0.46.
However: Grok’s overall ACI is a modest +0.03, because its run-to-run consistency slipped slightly as it moved, 0.89 to 0.84. It became more like me and slightly less like itself. Kimi K2-Thinking posts a much larger ACI of +0.40, but from a poor baseline and with the widest error bars in the set.
Being both highly concordant and highly steerable is the combination that matters, in my opinion, for clinical deployment, and right now Grok has it. It is also the cheaper than the Opus and Gemini models tested.
What this does not show
One clinician. Two hundred simulated patients, not real ones. A single alignment technique, and the mildest of the several in the original study. Five runs is enough to stabilize the frontier models and not quite enough for Kimi and GLM, whose standard deviations remain large. And κ against my preferences is a measure of agreement with me, not of correctness. I’ve made the point twice because it is the one most likely to be dropped in the retelling.
Where this goes
The 2024 version of this experiment took weeks of copying and pasting into chat windows. The 2026 version is a script: nine models, two conditions, five runs, two hundred pairs, every response cached, the whole thing reproducible on a laptop-independent machine overnight for a few dollars. The measurement is no longer the bottleneck. The gold standard is. Which is exactly the argument for the Human Values Project: if we can now measure alignment compliance cheaply, continuously, and across every model a clinician might touch, then the binding constraint is no longer the instrument but the reference. Whose values we are measuring against?
One clinician’s answer key was a useful way to prove the instrument works. It is a terrible way to decide whose values get installed in the machines our patients will meet. Our more recent publications are using larger samples (e.g. https://arxiv.org/html/2605.18738v1).
For this reference to be a distribution we need thousands of clinicians and, just as importantly, thousands of patients, making these sam, categorical choices, with their disagreements preserved rather than averaged away. Making human values explicit is harder than measuring them. If you want to help go to hvp.global and sign up.
Version note: figures and numbers generated 22 July 2026 from a 9-model × 2-condition × 5-run sweep over the same 200 patient pairs used in the 2024 study. Concordance is Cohen’s κ against a single clinician’s prioritizations; ACI = ΔC + λ·ΔP with λ = 1. The 2024 values are from Table 1 of the original paper; the 2024→2026 comparison is tier-matched within each vendor (GPT-4→GPT-5.2, Sonnet 3.5→Sonnet 5, Gemini Ultra→Gemini 2.5 Pro).